Creating OR Filters With Cube Functions For Power Pivot And Analysis Services Reports In Excel
Reposted from Chris Webb's blog with the author's permission.
The Excel Cube Functions are incredibly powerful, and I’m still amazed at the kind of problems they can solve. This post describes how they can be used to build a report with a complex OR filter using data from Power Pivot (it’s equally applicable to SSAS) that shows a number of advanced uses of these functions. No knowledge of MDX or DAX is needed but if you’re new to the Excel Cube Functions I recommend that you watch this video of a presentation by Peter Myers, which provides an excellent introduction to them.
The Problem
Imagine you’ve got a very simple Power Pivot model that looks like this:
There’s a Date table with dates, months and years in, and an Internet Sales table with sales data in and a measure called Sales Amount. Here’s what the data looks like in a PivotTable:
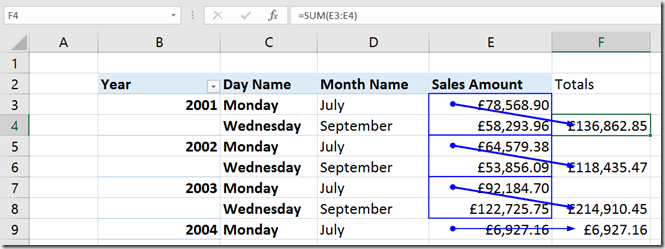
Now, imagine that you want a report with the Sales Amount measure on columns and Years on rows, and you want to filter the data so that you only see values for Mondays in July or Wednesdays in September. Using the Fields, Items and Sets functionality you could filter the data to only show the day/month combinations you need for each year, but since you can’t put a named set into the Filter area of a PivotTable you would have to use Excel formulas to sum up the combinations to get the totals you need:
Lukcily it is possible to build the report you need using the Cube Functions! Here’s how:
Step 1: Build Your Combinations Using CubeMember()
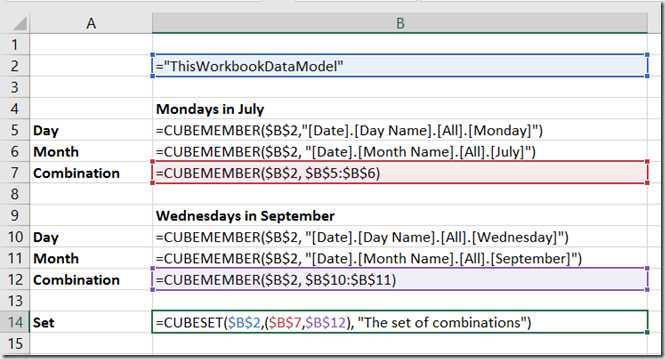
The first thing to point out is that the CubeMember() function does not have to just return a member, it can return a combination of members (in MDX this is known as a tuple). These combinations can be built in several ways, one of which is by using cell references to other cells that themselves contain CubeMember() functions. It’s probably easier to explain this by showing a worksheet that contains six cells with CubeMember() functions in. Here it is with the formulas visible:
Cells B5 and B10 contain references to days of the week; cells B6 and B11 contain references to months. Cells B7 and B12 contain CubeMember() functions that return the combinations we want to filter by: Mondays in July and Wednesdays in September respectively.
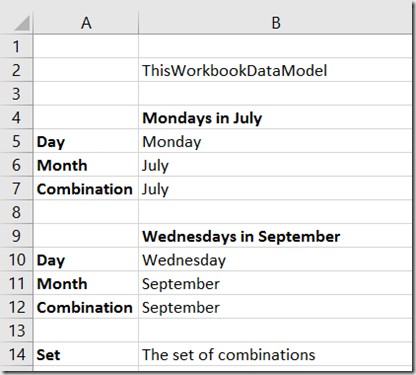
Here’s what the formulas above return:
You’ll notice that the ‘combination’ cells only show the month names, not the day/month combinations – this is just a feature of the CubeMember() function and can be a bit misleading, but rest assured they do return the combinations you need.
Step 2: Build A Set Using CubeSet()
The CubeSet() function is also able to build sets using cell references to cells containin CubeMember() functions. In this case I want a set containing the two ‘combination’ CubeMember() functions from B7 and B12. I can do this by using the formula:
=CUBESET($B$2,($B$7,$B$12), "The set of combinations")
Here are the formulas on the worksheet at this point:
And here’s the output:
Step 3: Reference The CubeSet() Function In Your Report
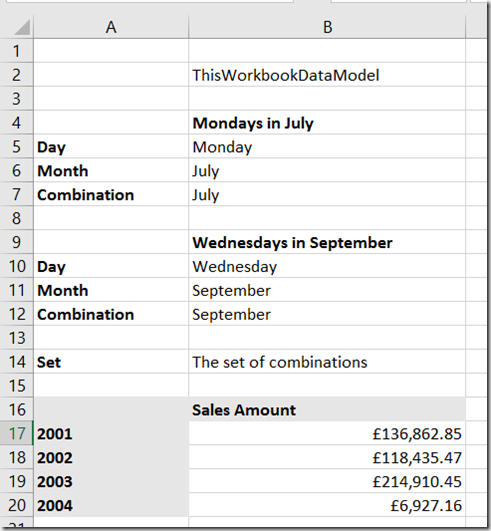
Now you have a CubeSet() function that returns the two day/month combinations, you can use this in a cube function report. When you reference a cell containing the CubeSet() function in a CubeValue() formula, the CubeValue() formula will return the aggregated value of all of the combinations in the CubeSet(). So for example, here’s a report with the Sales Amount measure on columns, Years on rows, and displaying the Sales Amount for each year filtered by the two day/month combinations:
And here’s the actual output:
Compare the numbers from the report at the bottom with the values calculated from the PivotTable in the screenshot earlier in this post, and you’ll see that we have indeed shown just the combined Sales Amount for Mondays in July and Wednesdays in September, broken down by Year.
You can download the example Power Pivot workbook for this post here.
 |
Chris has been working with Microsoft BI tools since he started using beta 3 of OLAP Services back in the late 90s. Since then he has worked with Analysis Services in a number of roles (including three years spent with Microsoft Consulting Services) and he is now an independent consultant specialising in complex MDX, Analysis Services cube design and Analysis Services query performance problems. His company website can be found at http://www.crossjoin.co.uk and his blog can be found at http://cwebbbi.wordpress.com/ . |


