Building Relative Date Reports in PowerPivot
Reposted from Chris Webb's blog with the author's permission.
It's a very common requirement when you're building a report in PowerPivot (or indeed in any BI tool) for it to automatically show data for today's date, the current week or month (plus maybe a set number of preceding days, weeks or months), without the user needing to change anything when they open the workbook. There are a number of ways of achieving this, but in this post I'm going to focus on one: building relative date columns in your Date dimension table. This stuff is by no means new and ground-breaking and I've seen this particular technique implemented many, many times, but it's also something I get asked about fairly frequently and I can't find any other blog posts detailing it so I thought I'd write it up.
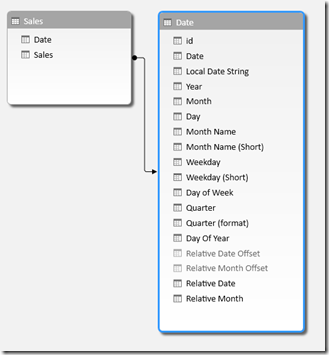
To show how this works I've built a sample PowerPivot model in Excel. An important part of this sample model is a proper Date dimension table of course, and if you don't have one in your data source there are plenty of ways of generating one automatically (Boyan Penev's DateStream dataset in the Azure Marketplace, for instance, or this cool new Excel 2013 app I found today in the Office Store). Here's the example I'll be working with which has a Date dimension table and a Sales fact table with some values in it:
On the Date dimension table I've added four new columns, two to handle relative dates and two to handle relative months:
Relative Date Offset
=INT([Date] – TODAY())
Relative Month Offset
=((12 * YEAR([Date])) + MONTH([Date])) – ((12 * YEAR(TODAY())) + MONTH(TODAY()))
Relative Date
=IF([Relative Date Offset]=0
, "Today"
, "Today " & IF([Relative Date Offset]>0, "+", "") & [Relative Date Offset])
Relative Month
=IF([Relative Month Offset]=0
, "Current Month"
, "Current Month " & IF([Relative Month Offset]>0, "+", "") & [Relative Month Offset])
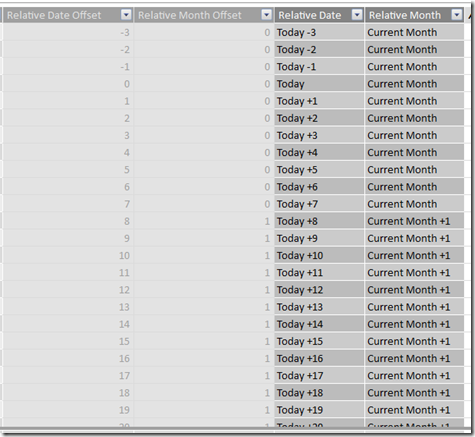
The first two of these columns contain integer values that are the number of days and months between today's date and the date in the [Date] column on the dimension table. I've hidden these from client tools, and then then used them in the expressions for (and as the Sort Columns for) the next two columns which show the same values in a more human-readable form. Here's what the results look like:
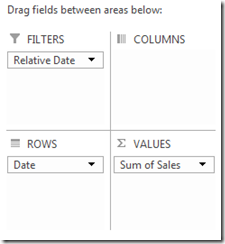
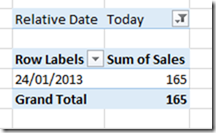
These new columns can be used in a variety of ways. For instance, I can now put my Sales measure in a PivotTable, put Relative Date in the Filter and select the 'Today' value, and then put Date on columns in the PivotTable and I'll only see today's date:
This is because, of course, selecting 'Today' on Relative Date automatically filters the [Date] column down to one value - today's date (ie January 24 2013).
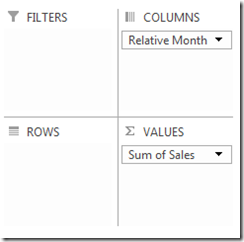
I can now also build reports that show data for the current month and previous month, without showing any dates at all:
There's one final problem that needs to be solved though: the relative dates are calculated when the Date dimension is loaded and the calculated columns evaluated, but what happens tomorrow when the relative dates need recalculating? If I was building this solution in SSAS Tabular and reprocessing your model every night automatically then I wouldn't have this issue; in PowerPivot I need to make sure I handle this. In Excel 2010 there's no way to automate loading data into a table, alas, so the user would have to do the refresh manually alas. In Excel 2013 I can do this using VBA very easily, by putting the following code in the WorkBook_Open() event:
ActiveWorkbook.Model.ModelTables("Date").Refresh
Refreshing the Date table also automatically refreshes your PivotTables too, which is handy. This means that when I open the workbook tomorrow (ie January 25 2013), the relative dates will have shifted accordingly and my report will show data as of January 25 2013 and not January 24 2013.
You can download my Excel 2013 sample workbook here.
 | Chris has been working with Microsoft BI tools since he started using beta 3 of OLAP Services back in the late 90s. Since then he has worked with Analysis Services in a number of roles (including three years spent with Microsoft Consulting Services) and he is now an independent consultant specialising in complex MDX, Analysis Services cube design and Analysis Services query performance problems. His company website can be found at http://www.crossjoin.co.uk and his blog can be found at http://cwebbbi.wordpress.com/ . |

