Monitoring SSAS Multidimensional MDX Query Results Serialisation, Part 2
Reposted from Chris Webb's blog with the author's permission.
In part 1 of this series I looked at the basics of monitoring SSAS Multidimensional query resultset serialisation in Profiler. In this post, I’ll be taking a look at what happens for queries that return large amounts of data
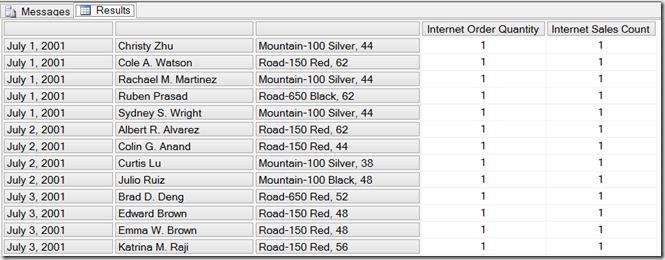
Consider the following query on the Adventure Works DW database, which, when I run it in SQL Server Management Studio returns a cellset with 60391 rows:
SELECT
{[Measures].[Internet Order Quantity],
[Measures].[Internet Sales Count]}
ON 0,
NON EMPTY
[Date].[Date].[Date].MEMBERS
*
[Customer].[Customer].[Customer].MEMBERS
*
[Product].[Product].[Product].MEMBERS
ON 1
FROM
[Adventure Works]
There are a couple of interesting things to note about this query. First, SQL Server Management Studio on my laptop says that it takes nine seconds to run, even on a warm cache; the Duration column for the Query End event in Profiler, however, shows a value of around six seconds. The three second difference must be the time it takes for SSAS to return the cellset to SQL Server Management Studio, and for SQL Server Management Studio to render the results (my guess is that it’s the second operation that takes the majority of this time – other client tools may be more efficient at rendering large resultsets).
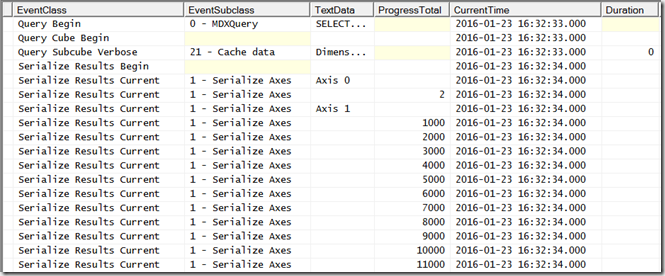
Secondly, in Profiler, you’ll see a much larger number of Serialize Results Current events. In situations where an axis contains more than a thousand tuples, or a cellset contains more than a thousand cells, you’ll see one Serialize Results Current event for each thousand tuples or cells. The ProgressTotal column will show values incrementing by one thousand up to the total number of tuples or cells. So, here’s some of what Profiler shows for the serialisation of the Rows axis:
…and here’s the end of the trace, showing the end of the serialisation of the cells (60391 rows * 2 columns = 120782 cells):
The third thing to notice is that there is only one Storage Engine operation – shown by the Query Subcube Verbose event in the first Profiler screenshot above – and that hits the Storage Engine cache and is so quick the Duration column shows 0 ms. Getting the raw data isn’t the problem here, and there aren’t any MDX calculations either – which means that it’s the Non Empty filter and construction of the cellset that is taking all the time. Since neither of these operations can be cached (although you can play tricks like this), this explains why the query always takes six seconds to run, even on a warm cache. Further investigation reveals that the Non Empty filter in fact only takes about a quarter of a second, so it’s the construction of a large cellset that’s the real problem here. This is why I say you should always avoid queries that return large amounts of data! SSAS is not very good at returning large resultsets.
Incidentally, don’t fall into the trap of thinking that the values shown in the Duration column for the Serialize Results End event only represents the amount of time taken to construct the cellset. It shows the amount of time since the Serialize Results Begin event, and in between the Begin and End events all kinds of other things necessary for the query to return (such as the evaluation of MDX calculations) could be going on. In a lot of cases the Serialize Results End event shows a duration that is almost the same as the duration for the whole query, but that only means that serialisation was able to start soon after the query began. In order to find the overhead of serialisation you need to work out how long all these other things take and subtract that from the duration shown for Serialize Results End, and that’s easier said than done.
Finally, what can you do to improve performance? Well, in the first post in this series I showed there was a tabular alternative to a cellset, and this is certainly a lot more efficient at returning large amounts of data (although you probably won’t have a choice in this unless you are building your own client tool, and, SSRS uses the tabular format anyway). For this query a tabular resultset is almost two seconds faster to return than a cellset, at just over four seconds:
There’s another important technique you can use, once that I have already mentioned in a blog post a couple of years ago but which is worth mentioning again: each cell returned by this query returns a large number of properties that you may not need, and these extra properties have a significant effect on the size of the resultset. Adding a CELL PROPERTIES clause to the query so that you only return the value property, like so:
SELECT
{[Measures].[Internet Order Quantity],
[Measures].[Internet Sales Count]}
ON 0,
NON EMPTY
[Date].[Date].[Date].MEMBERS
*
[Customer].[Customer].[Customer].MEMBERS
*
[Product].[Product].[Product].MEMBERS
ON 1
FROM
[Adventure Works]
CELL PROPERTIES VALUE
…takes another two seconds off the duration of the query, whether you use a tabular resultset or a cellset:
 |
Chris has been working with Microsoft BI tools since he started using beta 3 of OLAP Services back in the late 90s. Since then he has worked with Analysis Services in a number of roles (including three years spent with Microsoft Consulting Services) and he is now an independent consultant specialising in complex MDX, Analysis Services cube design and Analysis Services query performance problems. His company website can be found at http://www.crossjoin.co.uk and his blog can be found at http://cwebbbi.wordpress.com/ . |
Tags: mdx


