Monitoring SSAS Multidimensional MDX Query Results Serialisation, Part 1
Reposted from Chris Webb's blog with the author's permission.
Profiler (or indeed XEvents) can tell you a lot of interesting things about what happens when SSAS Multidimensional serialises the resultset returned by an MDX query. To be honest, this isn’t something I’ve looked at in detail before but recently I decided to do some research in this area – it turns out that monitoring the Profiler events related to serialisation can be very useful when you’re trying to understand what a Profiler trace is telling you about query execution as a whole.
To start off, let’s look at some very simple examples. Consider the following MDX query on the Adventure Works DW database:
SELECT
{[Measures].[Internet Order Quantity],
[Measures].[Internet Sales Count]}
ON 0,
[Date].[Calendar Year].[Calendar Year].MEMBERS
ON 1
FROM
[Adventure Works]
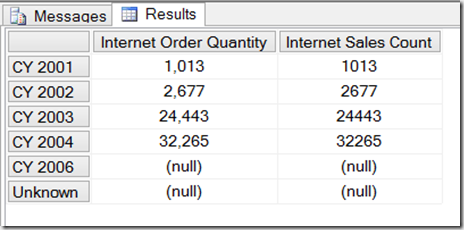
If you run it in SQL Server Management Studio in an MDX query window, you’ll get the following cellset back:
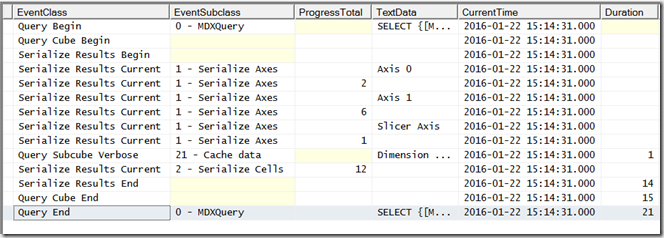
Running a Profiler trace using, amongst others, the Serialize Results Begin, Serialize Results Current and Serialize Results End events shows how SSAS is constructing the cellset returned:
The Serialize Results Begin event marks the point where SSAS starts to construct the cellset returned. The Serialize Results Current events that immediately follow it, with EventSubclass “1 – Serialize Axes” show SSAS serialising the tuples that are present on the Columns axis (listed as Axis 0 in the TextData column), the Rows axis (Axis 1) and the Where clause (Slicer Axis). The numeric values in the ProgressTotal column for the Serialize Results Current events shows the number of tuples on each axis: the two tuples on columns are the two measures, the six tuples on rows are the six years, and there’s one tuple on the slicer. After that SSAS gets the data for each of the cell values (as shown by the Query Subcube Verbose event – note that this query is running on a warm cache) and there is then a Serialize Results Current event with EventSubclass “2 – Serialize Cells”; the ProgressTotal column shows that twelve cells (2 columns * 6 rows) in total were returned. The Serialize Results End event shows that SSAS has finished constructing the cellset and not surprisingly it’s followed immediately by the Query Cube End and Query End events.
Sometimes SSAS needs to do a bit more work to find out what tuples are on an axis before serialisation can begin. The following query adds a NON EMPTY to the rows axis of the query above, so that only the rows that have values are returned:
SELECT
{[Measures].[Internet Order Quantity],
[Measures].[Internet Sales Count]}
ON 0,
NON EMPTY
[Date].[Calendar Year].[Calendar Year].MEMBERS
ON 1
FROM
[Adventure Works]
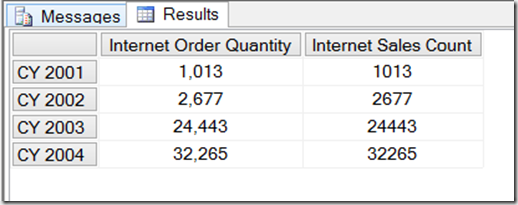
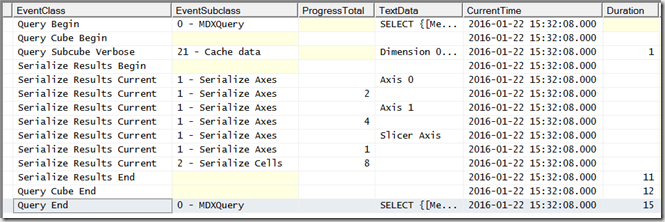
In order to know which years will appear on rows it has to query the cube to find out which ones have values for the measures on columns; as a result the Profiler trace shows a Query Subcube Verbose event appearing now before Serialize Results Begin:
This trace deliberately doesn’t show any of events related to the NON EMPTY operation (something I’ll be writing about in future blog posts), but it looks like SSAS can work out which years have values and get the values needed for the cellset back in a single operation so there’s no need for another Query Subcube Verbose event before the Serialize Cells event. Note that now the empty rows have been excluded, the ProgressTotal shows that only four tuples are returned on rows and eight cells are returned overall.
Cellsets are not the only type of resultset that SSAS can return though. Some client tools, most notably Reporting Services, return a tabular dataset that doesn’t have the concept of axes; running the previous query in SSRS gives the following in Profiler:
As you can there is now only one Serialize Results Current event and it has the EventSubclass “3 – Serialize SQL Rowset” (even though this is still an MDX query); the ProgressTotal column shows four, which is the number of rows returned.
In Part 2, I’ll look at what happens when a query returns a much larger amount of data.
 |
Chris has been working with Microsoft BI tools since he started using beta 3 of OLAP Services back in the late 90s. Since then he has worked with Analysis Services in a number of roles (including three years spent with Microsoft Consulting Services) and he is now an independent consultant specialising in complex MDX, Analysis Services cube design and Analysis Services query performance problems. His company website can be found at http://www.crossjoin.co.uk and his blog can be found at http://cwebbbi.wordpress.com/ . |
Tags: mdx


