Using TraceEvent for MDX Debugging
Reposted from Jason Thomas blog with the author's permission.
Do you know how it feels like to hear an old song and have a whole lot of memories come flooding back to you? Well, something sort of similar happened to me today. I was doing my weekly reading and going through a brilliant post by Microsoft MVP - Greg Galloway (blog). That was when I noticed that he had released a new functionality to the Analysis Services Stored Procedures (ASSP) Project on Codeplex. I decided to test this new functionality and was thinking of a scenario where I could use it, when I remembered about an old post in the Analysis Services forum that I intended to blog about but never did. 
Now the new addition to the ASSP toolkit is the TraceEvent class. Quoting from the ASSP project page -
“The function in the TraceEvent class is FireTraceEventAndReturnValue. It can be used to detect when Analysis Services is evaluating an expression since the function merely fires a trace event that appears in Profiler as a User Defined event, then returns the integer value you pass in. This function can be used in a scenario such as determining when the cell security expression is evaluated.
Here is an example MDX query displaying the usage of this function:
The signature of the function is:
FireTraceEventAndReturnValue(int)”
Having a base in programming, it was natural for me to expect a sort of “watch window” when I started learning MDX. I wanted to view the values and the change in them while the query was being debugged, but sadly there was none. The TraceEvent class will help alleviate that pain to some extent and I will be showing it in the next few minutes. For the purpose of demonstration, I would be taking the two queries from the AS forum post I mentioned before -
I) PROBLEM
Query 1
withmember [Product].[Product Categories].[Agg] as Aggregate(TopCount([Product].[Product Categories].[Product].members, 3, [Measures].[Internet Sales Amount]))select {[Measures].[Internet Sales Amount]} on 0,
[Date].[Calendar].[Month].members on 1
from [Adventure Works]
where ([Product].[Product Categories].[Agg])
Query 2
select {[Measures].[Internet Sales Amount]} on 0,
[Date].[Calendar].[Month].members on 1
from [Adventure Works]
where (TopCount([Product].[Product Categories].[Product].members, 3, [Measures].[Internet Sales Amount]))
Results
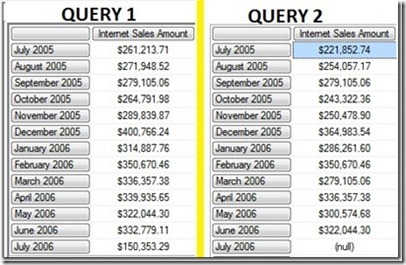
For a MDX beginner, you would expect the results to be same for both queries, as you are just moving the formula of the calculated member in Query 1 to the WHERE clause in Query 2. The reason for the difference is because calculations overwrite current coordinates while axes don't overwrite the current context. So when the first query is being executed, the current coordinates are overwritten and executed in the context of the query axis which means it will check the top 3 products for each of the month and display the result. However, in the second case, you don't have any calculations defined and hence the current coordinates would be the one in the WHERE clause, which is the Top count of products across all months. (You would get a better idea by reading the original post in the forum)
Enough of theory and let us see whether we can debug and understand the working of the mdx queries using the TraceEvent class. For the purpose of seeing the results, we will modify the queries as shown below and see the results in the Profiler.
II) DEBUGGING THE PROBLEM
Query 1 for July 2005
withmember [Product].[Product Categories].[Agg] as Aggregate(TopCount([Product].[Product Categories].[Product].members, 3, ASSP.FireTraceEventAndReturnValue([Measures].[Internet Sales Amount])))select {[Measures].[Internet Sales Amount]} on 0,
[Date].[Calendar].[Month].&[2005]&[7] on 1
from [Adventure Works]
where ([Product].[Product Categories].[Agg])
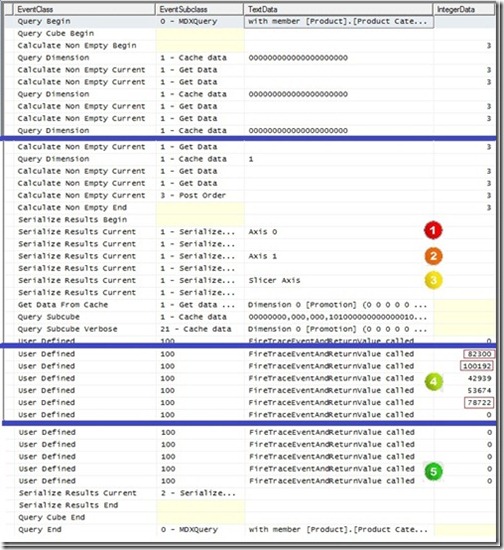
Profiler Results for Query 1
Even without knowing the theory part, you can find out that the measure gets evaluated at 4, which is after the axes get evaluated (1, 2 and 3 in the image above) and hence, the top 3 products would be calculated for the current context of July 2005. I have not pasted the entire trace here but if you run it, you can see that the measure values for each product for the month of July 2005 is returned in the Integer Data column. I have marked the top 3 values in red and you can see that this corresponds to $261,231 which is what we saw in the results for the first query.
Query 2 for July 2005
select {[Measures].[Internet Sales Amount]} on 0,
[Date].[Calendar].[Month].&[2005]&[7] on 1
from [Adventure Works]
where (TopCount([Product].[Product Categories].[Product].members, 3, ASSP.FireTraceEventAndReturnValue([Measures].[Internet Sales Amount])))
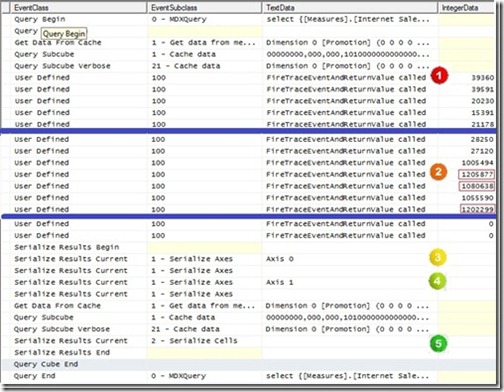
Profiler Results for Query 2
Here, you can see that the measure gets evaluated at 1, which is before the axes get evaluated (3 and 4 in the image above). I have also marked the top three values for the products, and on close examination, it can be found to be the top 3 values for products across all months.
So once the top products are found, the axes are evaluated and then the results are serialized in 5, which gives us the value of $221,852 which is what we saw in the results for the second query.
III) SUMMARY
Even without knowing the theory, we were able to debug the MDX queries and find out why there was a difference with the help of the TraceEvent function. This technique can be elaborated and used across variable scenarios for query debugging. In short, the TraceEvent functionality is a great function to have when you don’t know why you are getting some particular results in your queries. And yeah, don’t forget to thank Greg for this!![]()
 |
Jason has been working with Microsoft BI tools since he joined the IT industry in 2006. Since then he has worked across SSAS, SSRS and SSIS for a large number of clients. He is currently working for Mariner and is based out of Charlotte, NC. His personal blog can be found at http://road-blogs.blogspot.com |
Tags: mdx


