Flash Pivot Table Component by Flex Monster
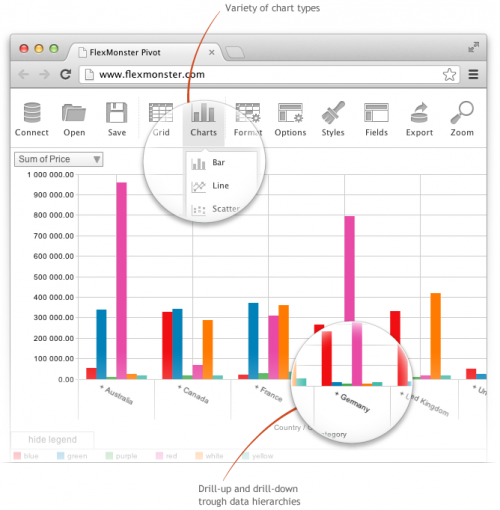
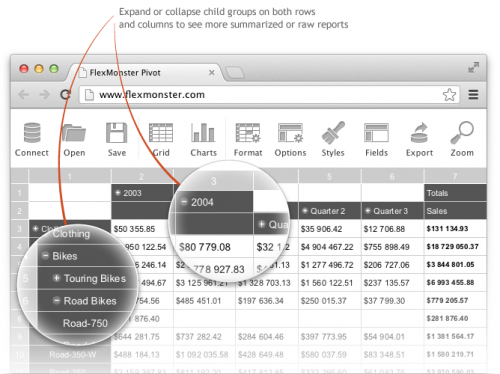
Flexmonster Pivot Table & Charts component - web client side component designed to view, analyze and manage multidimensional data online. It is an analogue of Microsoft Excel Pivot Table. The component can be integrated into any web applications or web sites. It has 2 main advantages from opposite types of applications:
- usability and speed of desktop application,
- mobility and scalability of web-based application.
Pivot Component provides Excel-like features which give users the interface they always used.
FEATURES:
- HTML5/Flex based pivot table and charts component
- Works great with Microsoft Analysis Services OLAP cubes and other databases or static CSV files
- XMLA and MDX support for multidimensional data visualization
- Different data sources - connecting via XMLA to OLAP cubes, using CSV data or getting data sets via API
- Composing the report is as easy as drag and drop of rows and columns
- Customizable - control look & feel with CSS & API
- Filtering, sorting and grouping data - Excel-like features provide users with interface they got used to
- The filter supports huge data hierarchies with multi-select and searching the data
- Top 10 records provides the possibility to focus an attention only on the highly relevant data and hide all the other information
- Easy embedding into Web apps using JavaScript API (HTML5 component), easy embedding into Flex apps as SWC component
- Extremely fast for a huge amounts of data. The component is seriously optimized for huge data sets for smooth browsing and scrolling really long reports. It is thoroughly tested to work with up to 100MB data files and huge OLAP cubes data volumes. Maximum data size is limited only by your end-users' browsers and the capacity of their computers
- Visible text of the Pivot Component can be translated with special localization to fit multi-language requirements
- Export & Print - Export to PDF, Excel, HTML, CSV & images.
Read more about this product...


