Power BI Desktop, Sort By Column And DAX Calculations That Use The All() Function
Reposted from Chris Webb's blog with the author's permission.
Recently I came across a problem where a DAX measure gave different results in Excel and Power BI Desktop. It turned out not to be a bug or even a feature, but since it confused me for a few minutes I thought it was worth writing up in case anyone else ran into it.
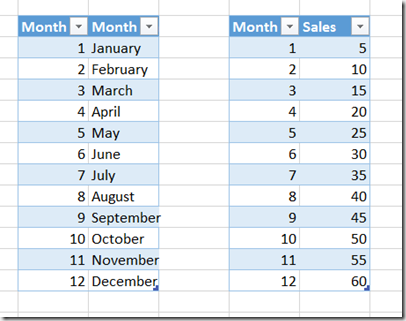
Consider a model built in Excel using Power Pivot from the following two tables:
With two measures defined in the model as follows:
Sum of Sales:=SUM(Sales[Sales])
Share:=DIVIDE([Sum of Sales], CALCULATE([Sum of Sales], ALL(Month[Month Name])))
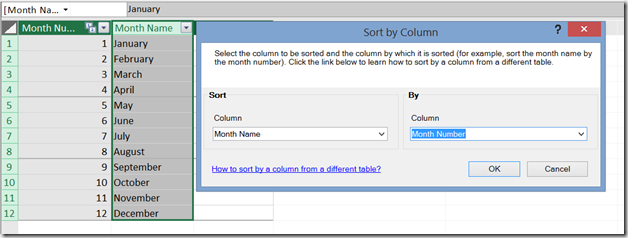
…and, importantly, the Sort By Column property on the Month Name column set to Month Number:
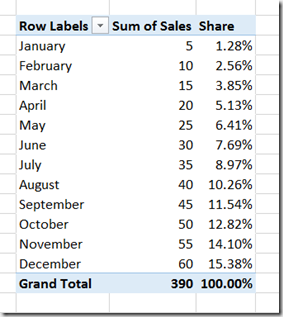
…it’s possible to build a PivotTable that looks like this:
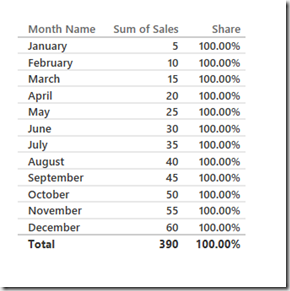
However, when you import the same model into Power BI Desktop and recreate the PivotTable above in the Report view you’ll see that the Share calculation no longer gives the same values:
What’s the problem here? It’s all down to the way Power BI Desktop generates DAX queries when you set the Sort By Column property. The Excel PivotTable above generates the following MDX:
SELECT
{[Measures].[Sum of Sales],[Measures].[Share]}
DIMENSION PROPERTIES PARENT_UNIQUE_NAME,MEMBER_VALUE,
HIERARCHY_UNIQUE_NAME ON COLUMNS ,
NON EMPTY
Hierarchize(
{DrilldownLevel({[Month].[Month Name].[All]},,,INCLUDE_CALC_MEMBERS)})
DIMENSION PROPERTIES PARENT_UNIQUE_NAME,MEMBER_VALUE,
HIERARCHY_UNIQUE_NAME ON ROWS
FROM [Model]
CELL PROPERTIES VALUE, FORMAT_STRING, LANGUAGE,
BACK_COLOR, FORE_COLOR, FONT_FLAGS
On the rows axis, as you would expect, the only hierarchy you see is Month Name.
However, if you run a Profiler trace (you can find out how to do this here although it’s much easier to get the Process ID from DAX Studio) to look at the DAX query generated by Power BI you’ll see
EVALUATE
TOPN (
    102,
    SUMMARIZECOLUMNS (
        ROLLUPADDISSUBTOTAL (
            ROLLUPGROUP ( 'Month'[Month Name], 'Month'[Month Number] ),
            "IsGrandTotalRowTotal"
        ),
        "Share", 'Sales'[Share],
        "Sum_of_Sales", 'Sales'[Sum of Sales]
    ),
    [IsGrandTotalRowTotal], 0,
    'Month'[Month Number], 1,
    'Month'[Month Name], 1
)
ORDER BY
    [IsGrandTotalRowTotal] DESC,
    'Month'[Month Number],
    'Month'[Month Name]
The difference here is that the Month Number and Month Name fields are both present – they have to be since the query has to sort by Month Number. In MDX the order of members on a hierarchy can be set inside the model; in a DAX query you can only sort using an ORDER BY clause and for that to work, the field you’re ordering by must be present in the query.
The Share measure calculation needs to be changed in order to fix this, then. Here’s one way of doing this:
Share =
DIVIDE([Sum of Sales],
CALCULATE([Sum of Sales], ALL(Month[Month Name], ‘Month'[Month Number])))
 |
Chris has been working with Microsoft BI tools since he started using beta 3 of OLAP Services back in the late 90s. Since then he has worked with Analysis Services in a number of roles (including three years spent with Microsoft Consulting Services) and he is now an independent consultant specialising in complex MDX, Analysis Services cube design and Analysis Services query performance problems. His company website can be found at http://www.crossjoin.co.uk and his blog can be found at http://cwebbbi.wordpress.com/ . |


