oint-In-Time Dimension Reporting In DAX
Reposted from Chris Webb's blog with the author's permission.
Before I start, I have to state that the technique shown in this post isn't mine but was developed by my colleague Andrew Simmans, who has very kindly allowed me to blog about it.
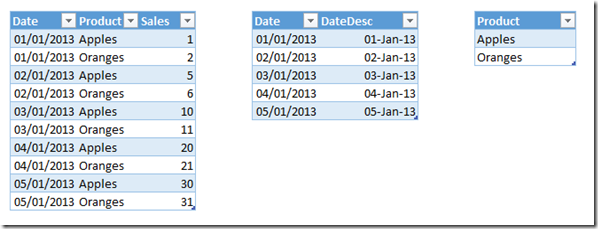
Over the last few months I've been working on an SSAS Tabular project that has not only presented some interesting modelling challenges, but has shown how DAX can offer some new and interesting solutions to these challenges. Consider the following scenario: a supermarket sells products, and we have a fact table showing sales of products by day. Here's some sample data:
To complicate matters, each product has one product manager but product managers for particular products change from time to time. Normally this might be solved by adding the product manager name to the Product dimension table and implementing a Type 2 Slowly Changing Dimension. In this case, though, we want something slightly different: instead of seeing sales attributed to the product manager who was in charge of the product at the time of the sale, and therefore seeing sales for the same product attributed to different product managers on different dates, we want to attribute all sales for a product to a single product manager but be able to use a second date dimension to be able to determine the point in time, and therefore the product manager in charge of each product at that point in time, that we want to report as of. To put it another way, we want to be able to find the state of a dimension on any given date and use that version of the dimension to do our analysis.
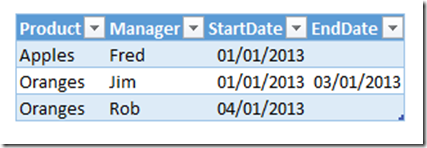
For example, we have the following table showing which product manager was in charge of each product at any given point in time:
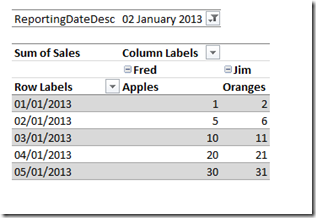
Between January 1st 2013 and January 3rd 2013 Jim was the product manager for Orange, but from January 4th 2013 onwards Rob took over as product manager for Oranges; Fred was the product manager for Apples the whole time. We want a PivotTable that looks like this when we choose to report as of January 2nd 2013:
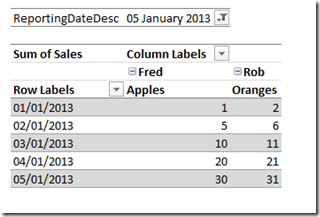
Notice how Jim is shown as the product manager for Oranges. If we wanted to report using the managers as of January 5th 2013, we would want to see Rob shown as the product manager for Oranges like so:
The solution to this problem involves a combination of two DAX techniques that have already been blogged about quite extensively and which I'd encourage you to read up on:
- Many-to-many relationships, in this case the solution developed by Gerhard Brueckl, described on his blog here.
- 'Between' date filters, which I wrote about recently but which Alberto has recently improved on in his must-read white paper here.
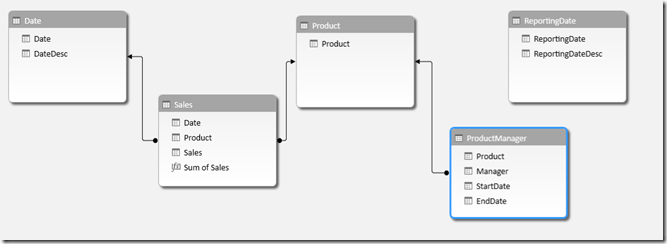
Here are the table relationships I've used for the sample scenario:
I've added a second date table called ReportingDate which contains the same rows as the Date table shown above; note that it has no relationship with any other table.
This problem is very similar to a many-to-many relationship in that a product can have many managers across time, and a manager can have many products. Indeed we could model this as a classic many-to-many relationship by creating a bridge table with one row for each valid combination of product and manager for each possible reporting date; on my project, however, this was not a viable solution because it would have resulted in a bridge table with billions of rows in it. Therefore, instead of joining the ReportingDate table directly to the ProductManager table, we can instead filter ProductManager using the between date filter technique.
Here's the DAX of the Sum of Sales measure used in the PivotTables show above:
Sum of Sales:=
IF( HASONEVALUE(ReportingDate[ReportingDate]),
CALCULATE(
SUM(Sales[Sales]), FILTER(ProductManager, MIN(ReportingDate[ReportingDate])>=ProductManager[StartDate] &&
IF(ISBLANK(ProductManager[EndDate]), TRUE(),
MIN(ReportingDate[ReportingDate])<=ProductManager[EndDate]) ))
, BLANK()
)
This is not necessarily the best way to write the code from a performance point of view but it's the most readable - if you need better performance I recommend you read Alberto's white paper. What I'm doing is this:
- Only return a value if a single reporting date is selected
- Filter the ProductManager table so only the rows where the selected reporting date is between the start date and the end date are returned, ie we only get the rows where a manager was in charge of a product on the reporting date
- Use the filtered ProductManager table to filter the main fact table using the Calculate() function, in exactly the same way that you would with a many-to-many relationship
You can download my sample workbook here.
 | Chris has been working with Microsoft BI tools since he started using beta 3 of OLAP Services back in the late 90s. Since then he has worked with Analysis Services in a number of roles (including three years spent with Microsoft Consulting Services) and he is now an independent consultant specialising in complex MDX, Analysis Services cube design and Analysis Services query performance problems. His company website can be found at http://www.crossjoin.co.uk and his blog can be found at http://cwebbbi.wordpress.com/ . |

