Dynamic DAX Query Tables in Excel 2013
Reposted from Chris Webb's blog with the author's permission.
PivotTables are all well and good, but sometimes when you're building reports you just want a plain old list of things. Excel tables are perfect for this, and in Excel 2013 you can bind a table to the results of a static DAX query against the Excel Data Model. Unfortunately it's not possible to make this query dynamic without a bit of VBA - so in this post I'll show you how to do it.
Before I start, though, you may be thinking "What's the point of this?". After all, if you have too much data for the native Excel table functionality to handle, you can always use the Excel Data Model and make a PivotTable look just like a table, and when you do that you can use filters, slicers and so on to control what gets displayed. This is certainly a valid approach but the big disadvantage of a PivotTable is that it doesn't always give you the best possible performance because of the way it generates its MDX, and because DAX queries are anyway faster than MDX queries for this kind of detail-level reporting. For large tables with lots of columns then a hand-rolled DAX query might give you significantly better performance than a PivotTable, as well as more control over the filtering logic.
Let's look at a worked example.
Step 1: Import some data into a table
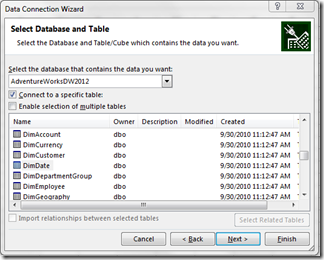
For my example, I have imported the DimDate table from the Adventure Works DW database in SQL Server into a table in Excel.
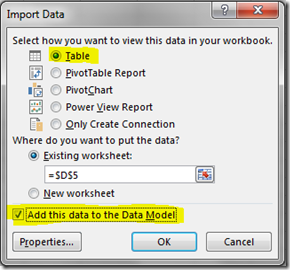
The key thing to remember at this point is to make sure you check the box to add the data to the Excel Data Model:
Step 2: Define a DAX query for this table
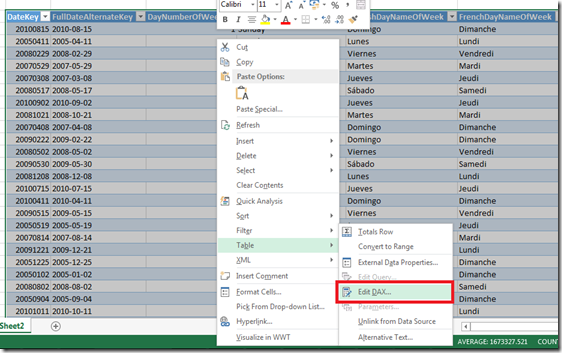
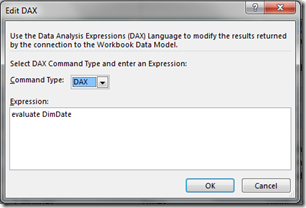
Kasper shows here how to use a static DAX query to populate a table in Excel, so I won't repeat what he says. All I've done in my example is to change the table to use the following DAX query:
evaluate DimDate
.which returns the whole contents of the DimDate table, so in fact at this point the table looks exactly the same as it did before I made this change.
Step 3: Add some UI to allow the user to filter the data
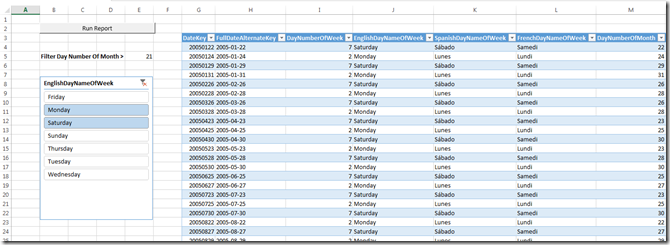
Now I want the user to be able to filter this table in two ways:
1. By using a slicer to control which days of the week are displayed
2. By entering a value into a cell, and filtering the table so only the rows where the day number of the month is greater than that value
Here's what this looks like:
I've also added a 'Run Report' button onto the worksheet for the user to press when they want to refresh the data in the query
Step 4: Use VBA to dynamically generate the query used by the table
The challenge is now to take the selection in the slicer and the value entered for the day number of month filter and use that to construct a DAX query.
Here's an example of what one of these DAX queries might look like:
evaluate
Filter(
DimDate
, DimDate[DayNumberOfMonth]>21
&& (DimDate[EnglishDayNameOfWeek]=”Monday” || DimDate[EnglishDayNameOfWeek]=”Saturday”))
order by DimDate[DateKey]
Here I'm filtering the DimDate table so that the only rows displayed are where day number of month is greater than 21, and day name of week is either Monday or Saturday. If you're interested in learning more about writing DAX queries, check out the series of blog posts I wrote on this topic here.
Paul te Braak has a great post here on how to work out what has been selected in a slicer using VBA, and I need to acknowledge the fact I've borrowed some of his code! Here's my VBA routine, called by the button on the worksheet, to build and run the query:
Sub RunReport() Dim SC As SlicerCache Dim SI As SlicerItem
Dim SelectedList As String Dim DayNumberOfMonthFilter As String
Dim DAXQuery As String Dim DemoWorksheet As Worksheet
Dim DAXTable As TableObject
Set DemoWorksheet = Application.Worksheets("TableDemo")
'Find the value of the cell containing the Day Number Of Month filter value DayNumberOfMonthFilter = DemoWorksheet.Range("DayNumberOfMonthFilter").Value
'Find what is selected in the slicer Slicer_EnglishDayNameOfWeek Set SC = ActiveWorkbook.SlicerCaches("Slicer_EnglishDayNameOfWeek") SelectedList = ""
'Loop through each item in the slicer and if it is selected 'add it to a string that will be used in the filter condition For Each SI In SC.SlicerCacheLevels(1).SlicerItems
If SI.Selected Then If SelectedList <> "" Then
SelectedList = SelectedList & " || " End If
SelectedList = SelectedList & "DimDate[EnglishDayNameOfWeek]=""" & SI.Caption & """" End If
Next 'Construct the DAX query DAXQuery = "evaluate Filter(DimDate, DimDate[DayNumberOfMonth]>" & DayNumberOfMonthFilter
DAXQuery = DAXQuery & " && (" & SelectedList & ")) order by DimDate[DateKey]"
'Bind the table to the DAX query Set DAXTable = DemoWorksheet.ListObjects("Table_DimDate").TableObject
With DAXTable.WorkbookConnection.OLEDBConnection .CommandText = Array(DAXQuery) .CommandType = xlCmdDAX End With
'Run the query ActiveWorkbook.Connections("ModelConnection_DimDate").Refresh End Sub
And so there we go, a dynamic DAX table report in Excel 2013. If you'd like to download my example and check it out in detail, you can get hold of it here.
 | Chris has been working with Microsoft BI tools since he started using beta 3 of OLAP Services back in the late 90s. Since then he has worked with Analysis Services in a number of roles (including three years spent with Microsoft Consulting Services) and he is now an independent consultant specialising in complex MDX, Analysis Services cube design and Analysis Services query performance problems. His company website can be found at http://www.crossjoin.co.uk and his blog can be found at http://cwebbbi.wordpress.com/ . |

