Group Multiple Rows to Single Delimited Row in PowerPivot
Reposted from Jason Thomas blog with the author's permission.
When PowerPivot was announced a couple of years back, I was one among the many who started feeling insecure on having to learn a new trade. I could have sat there and kept on cribbing, or picked myself up and started my baby steps towards the new technology. As Hillary Clinton said, the challenges of change are always hard. It is important that we begin to unpack those challenges and realize that we each have a role that requires us to change and become more responsible for shaping our own future. I am glad that I gave PowerPivot a chance and kept on learning (it sure helps sitting next to a passionate PowerPivot supporter like Javier Guillen!), else I wouldn’t have realized how much useful it is to me. Agreed that it has it’s fair sets of limitations, but as the community grows and the technology matures, we will see that many of it gets resolved or have workarounds. For eg, if you had asked me before on whether there was any way in PowerPivot to group all the row values into a single delimited row, I would have said no. But seeing this question in the PowerPivot forum, I decided to spend a little more time in the weekend and found a workaround, which I am sharing through this post.
Scenario
Let us say that we have a table which shows the sales by Country and State. The result should be a table which shows the sum of sales by country along with a delimited row of states as shown below
Solution
There is only one function (atleast as far as I know) in PowerPivot that returns a delimited list from multiple rows – PATH(). But the issue is that PATH() works only with a parent child hierarchy. So the trick for getting this piece done would be to build an artificial parent child hierarchy. Follow the steps below to get the solution:-
1) Make a calculated column called Rnk which will generate a running number of the states within a country.
=RANKX (
FILTER ( All ( Table1 ), Table1[Country] = EARLIER ( Table1[Country] ) ),
Table1[State], , 1, DENSE
)
This will allow us to uniquely identify each state value within a country.
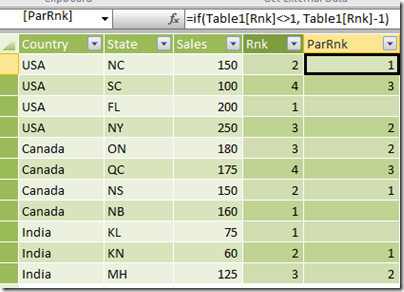
2) Make a calculated column called ParRnk with the formula below
=IF (
Table1[Rnk] <> 1,
Table1[Rnk] - 1
)
This will allow us to get the parent node id of the parent child hierarchy.
3) Now, make a calculated column called ParState which will get the Parent State for the current row (based on the ParRnk column).
=CALCULATE (
FIRSTNONBLANK ( Table1[State], 1 ),
FILTER (
ALLEXCEPT ( Table1, Table1[Country] ),
Table1[Rnk] = EARLIER ( Table1[ParRnk] )
)
)
4) The final part of the solution is to make the delimited list column by using the path function where State is the child node and ParState is the parent node. But if we directly apply the PATH function in each row, we will not get the intended results as you can see in the image below.
What we need is the delimited list value for the row with the maximum rank in each country applied across all other rows in that country. For that, make a calculated column called ConcatStates with the formula below
=CALCULATE (
PATH ( Table1[State], Table1[ParState] ),
CALCULATETABLE (
FILTER ( Table1, Table1[Rnk] = Max ( Table1[Rnk] ) ),
ALLEXCEPT ( Table1, Table1[Country] )
)
)
Now the results should look like below
Now make a new pivot table and drag and drop the Country, ConcatStates and Sales fields to see the intended results
Wasn’t that a fascinating workaround? If you want to play around, you can download the excel file from here.
 | Jason has been working with Microsoft BI tools since he joined the IT industry in 2006. Since then he has worked across SSAS, SSRS and SSIS for a large number of clients like Unilever, Imperial Tobacco, IATA, Schneider Electric, etc. He is currently working at MindTree Ltd, Bangalore (www.mindtree.com) and his personal blog site can be found at http://www.sqljason.com His blogs can also be found at the popular technical site BeyondRelational.com at http://beyondrelational.com/blogs/jason |


