Creating A Partitioned Table In SSAS Tabular 2017 And SSDT Using M Functions
Reposted from Chris Webb's blog with the author's permission.
One of the coolest new features in SSAS Tabular 2017 and Azure Analysis Services is the integration of Power Query and M for data loading. Over the last year or so the Analysis Services team blog has posted a lot of fairly complex examples of how to use this functionality, but now that the latest release of SSDT has proper support for shared expressions I thought it would be a good idea to show a simple example of how to use it to create a partitioned table using M functions.
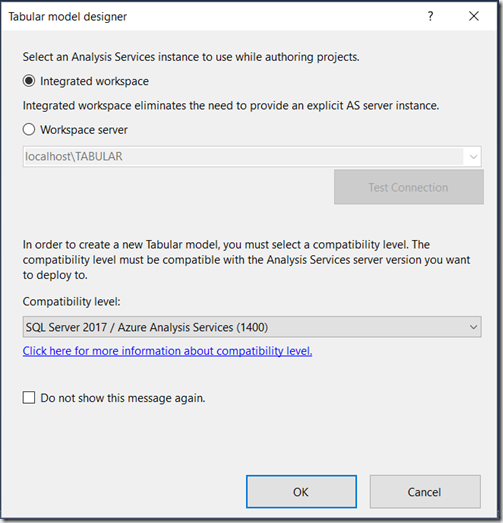
For this example I’ll be using the FactInternetSales fact table from the Adventure Works DW sample database, and the aim is to create a table in an SSAS Tabular project that has one partition for each year of data in FactInternetSales. Assuming that a new SSAS Tabular project has been created at the 1400 compatibility level with an integrated workspace:
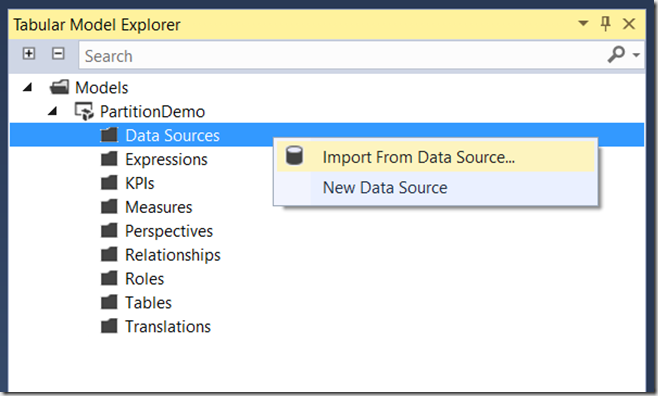
…the first thing to do is to right-click on the Data Sources folder in the Tabular Model Explorer pane and select Import From Data Source:
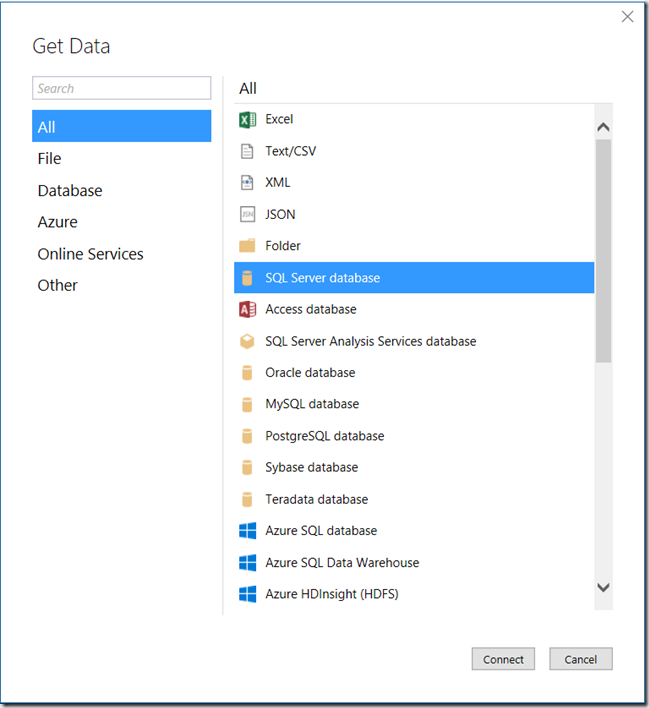
This brings up the Get Data dialog:
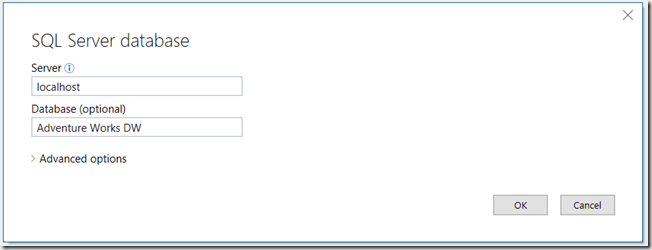
Select SQL Server database and then click Connect. Enter the server name and database name in the SQL Server database dialog:
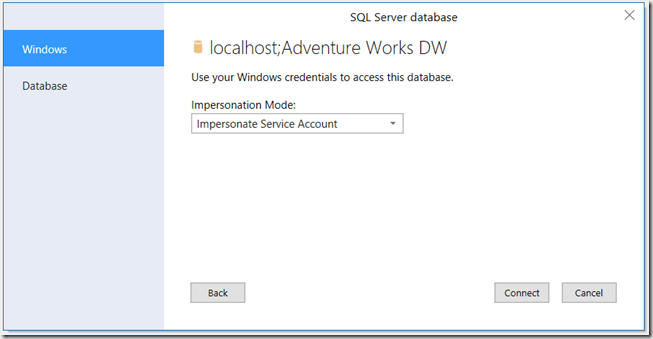
Choose how SSAS is to authenticate when it connects to the SQL Server database and click Connect:
Select the FactInternetSales table from the list of tables in the Adventure Works DW database:
This opens the Query Editor window; in it there is one query called FactInternetSales:
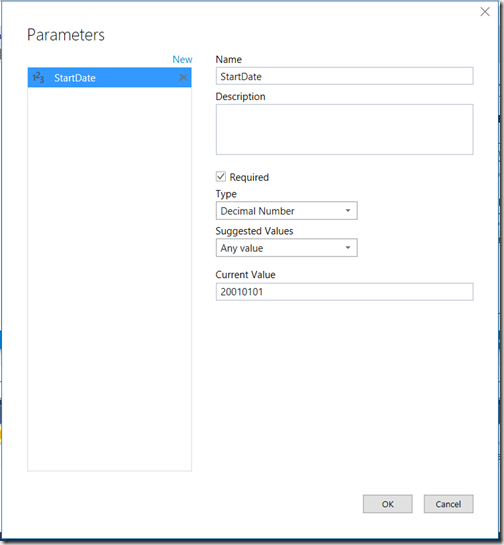
Here’s where it gets interesting. The first thing to do is to create a function that returns a filtered subset of the rows in the FactInternetSales table using the technique I blogged about here for Power BI. On the Query Editor menu bar, click Query/Parameters/New Parameter and create two new parameters called StartDate and EndDate that return the numbers 20010101 and 20011231. Here’s what they should look like:
These parameters are going to be used to filter the OrderDateKey column on the FactInternetSales table. Do this by clicking on the down arrow on the column header of OrderDateKey then selecting Number Filters and then Between:
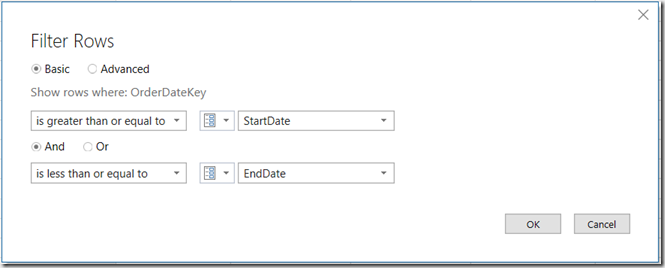
In the Filter Rows dialog use the StartDate parameter for the start of the filter range and the EndDate parameter for the end of the filter range, then click OK:
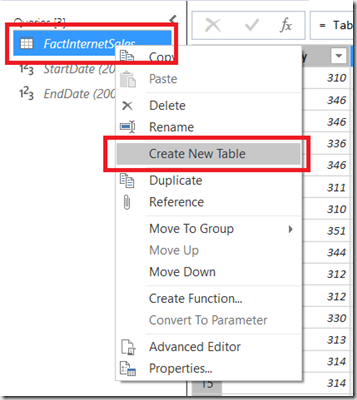
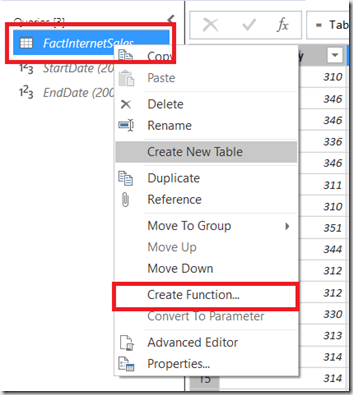
Because the OrderDateKey contains dates stored as numbers in the YYYYMMDD format the result is a table that only contains sales where the order date is in the year 2001. This table should not be loaded into SSAS though, so right click on the FactInternetSales in the Queries pane and make sure that the Create New Table is not checked:
Next, on the same right-click menu, select Create Function:
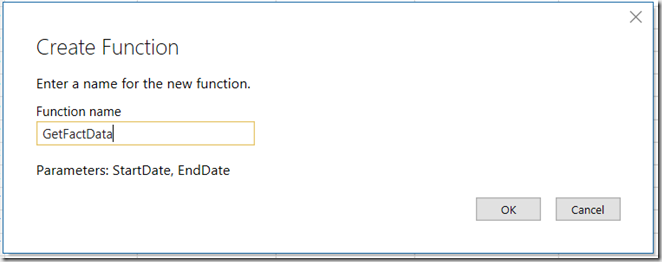
In the Create Function dialog name the new function GetFactData then click OK:
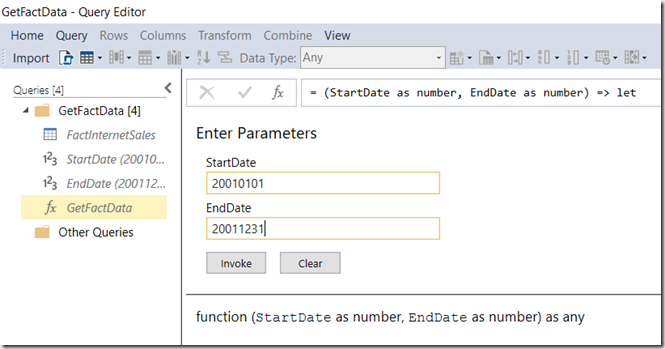
The new GetFactData function will now be visible in the Queries pane; enter 20010101 for the StartDate parameter and 20011231 for the EndDate parameter and click Invoke:
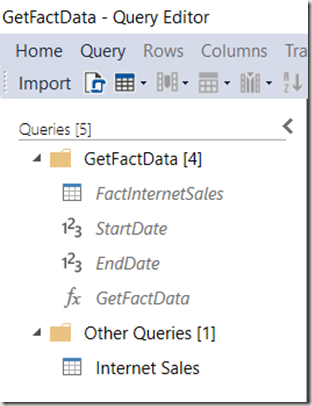
This creates yet another new query called Invoked Function which should be renamed Internet Sales:
Right-click on this query and make sure Create New Table is selected. Next, click the Import button on the toolbar to close the Query Editor and load the Internet Sales table into SSAS.
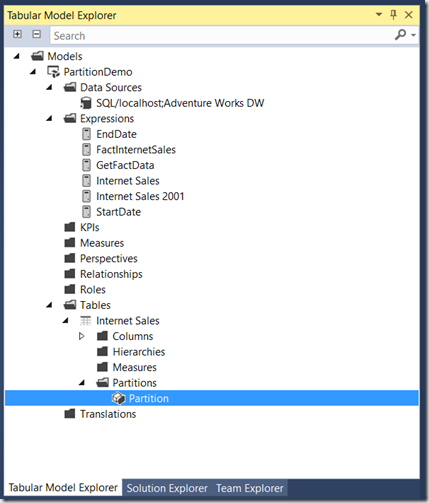
At this point the Tabular Model Explorer will show all of the queries created above listed under the Expressions folder, and a single table called Internet Sales with a single partition:
Next, right-click on the Internet Sales table in the Tables folder and select Partitions:
This opens the Partition Manager dialog. Rename the existing partition to Internet Sales 2001:
Note that the M query for this partition calls the GetFactData() function to get the rows from FactInternetSales where OrderDateKey is between 20010101 and 20011231:
let
    Source = GetFactData(20010101, 20011231)
in
    Source
Click the New button to create new partitions, one for each year of data in the FactInternetSales table. Each new partition will initially contain the same M code shown above and should be edited so that the query gets data for the appropriate year:
Click OK, and the end result is a table with one partition per year:
What’s the point of using M functions to return the data for a partition, rather than the traditional method of using a SQL query embedded in each partition? One reason to do this would be to make maintenance easier: if you need to do something like add a new column to a fact table, rather than editing lots of partitions you just need to edit the function and all the partitions will reflect that change. I can think of a few others, but I’ll save them for future blog posts…
 |
Chris has been working with Microsoft BI tools since he started using beta 3 of OLAP Services back in the late 90s. Since then he has worked with Analysis Services in a number of roles (including three years spent with Microsoft Consulting Services) and he is now an independent consultant specialising in complex MDX, Analysis Services cube design and Analysis Services query performance problems. His company website can be found at http://www.crossjoin.co.uk and his blog can be found at http://cwebbbi.wordpress.com/ . |
Tags: design, management, tabular

