More Detail On Detail Rows Expressions In SSAS Tabular V.Next
Reposted from Chris Webb's blog with the author's permission.
My second-favourite feature in SSAS Tabular v.next after Power Query integration is the Detail Rows expression property for measures – it not only brings drillthrough on measures to Tabular, it means that we can define meaningful drillthrough on any measure, no matter how it is calculated. There’s a basic description of the functionality in this blog post but I thought it would be useful to walk through a simple example showing how it can be used.
Consider a simple SSAS Tabular model with two tables in it. First, a table containing sales data called Sales:
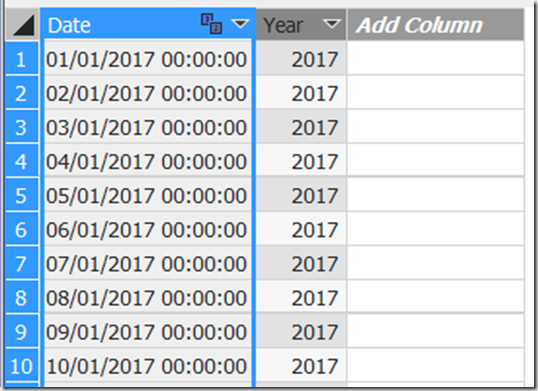
Second, a date table called Date:
[Note: dates are in DD/MM/YYYY format]
There are two measures with the following definitions:
Total Sales:=SUM(Sales[Sales])

Total YTD Sales:=TOTALYTD([Total Sales], 'Date'[Date])
The measure Total YTD Sales gives the running total of sales from the beginning of the current year. I know it doesn’t follow Marco and Alberto’s best-practice pattern but I wanted to keep things simple on the DAX front…
Browsing the model in an Excel PivotTable gives the following result:
At this point if you double-click on cell C6 in the PivotTable you get the following, not very useful result, on a new worksheet:
What drillthrough does in SSAS Multidimensional, and what the new Detail Rows Expression property in SSAS Tabular v.next does, is allow an end user to see the detail-level data (usually the rows in the fact table) that was aggregated to give the value the user clicked on in the original PivotTable.
For the Total Sales measure, this property can be set with a DAX expression that returns a table something like this:
SELECTCOLUMNS(
	'Sales',
	"Date", 'Sales'[Date],
	"Sales Value", [Total Sales]
)
[For more details on the SelectColumns() function, see here]
Now when you click on cell C6 in the PivotTable you get the result of the table expression above filtered by the context of the cell you’ve clicked on – in this case, the date 4/1/2017. What appears in the new worksheet is data from the row from the Sales table for 4/1/2017:
This is already better than SSAS Multidimensional drillthrough because as a developer you have control over the column headers displayed in this table (in Multidimensional drillthrough the column names come out in a ridiculously user-unfriendly format) and the order that they are displayed in (which is equally painful to control in Multidimensional).
Now, consider cell D6 in the PivotTable, the cell that shows the year-to-date sales amount for 4/1/2017. If a user double-clicked on this cell they would expect to see all of the rows from the Sales table from 1/1/2017 to 4/1/2017, the rows whose sales have been aggregate to give the YTD total.
This can be achieved using the following expression in the Detail Rows Expression for the Total YTD Sales measure:
CALCULATETABLE(
	SELECTCOLUMNS(
		'Sales',
		"Date",
		'Sales'[Date],
		"Sales Value",
		[Total Sales]
	),
	DATESYTD('Date'[Date])
)
Now, double-clicking on cell D6 in the PivotTable gives the following table:
It may not look all that impressive, but there are few words that can describe how happy this makes me feel. This is exactly what is not possible with drillthrough in SSAS Multidimensional, and why drillthrough in Multidimensional has always been so frustrating to use. It’s great to see the feature properly implemented in Tabular.
 |
Chris has been working with Microsoft BI tools since he started using beta 3 of OLAP Services back in the late 90s. Since then he has worked with Analysis Services in a number of roles (including three years spent with Microsoft Consulting Services) and he is now an independent consultant specialising in complex MDX, Analysis Services cube design and Analysis Services query performance problems. His company website can be found at http://www.crossjoin.co.uk and his blog can be found at http://cwebbbi.wordpress.com/ . |


