Using the Resource Usage Profiler Event For SSAS Multidimensional Query Performance Tuning, Part 1: Rows Scanned And Rows Returned
Reposted from Chris Webb's blog with the author's permission.
If you’re performance tuning SSAS Multidimensional Storage Engine issues, the Resource Usage Profiler event can provide a lot of useful information about what’s going on behind the scenes when you run a query. This is something I have blogged about in the past (and it will be useful to read this post before carrying on) but recently I’ve done some more research into this area and found out a lot more things about what this event tells you.
For my testing I created a very simple cube from a single fact table. The table contained 5000 rows and two columns: a dimension key column containing the values 1 to 5000, and a measure column that always contained the value 1. From this I built a single measure group with a single measure called My Measure, and a single dimension built from the dimension key column with 5000 members on it called ID.
Consider the following MDX query:
SELECT
{[Measures].[My Measure]}
ON 0
FROM
[MyCube]
WHERE([ID].[ID].&[1])
Here’s the output:
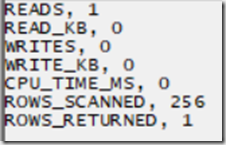
In this query the WHERE clause filters the output to one member from the ID dimension, which in turn returns data from one row in the underlying fact table, and so My Measure returns 1. If the query is run on cold cache, the Resource Usage Profiler event returns the following:
The ROWS_RETURNED value here returns 1, which is what you might expect – the query results show data from one row in the underlying fact table. The ROWS_SCANNED value is 256 though. Why? Chapter 20 of the book “Microsoft SQL Server 2008 Analysis Services Unleashed” has a lot of detail about how SSAS MD stores data on disk, but the important point here is that the data in a partition is stored on disk in segments, with each segment made up of pages, and when a query is run SSAS will scan all the pages that it thinks contain data. The ever-reliable Akshai Mirchandani of the SSAS dev team helped me with the remaining information I needed:
- There are 65536 rows of data per segment
- There are 256 pages per segment
- There are therefore, at most, 256 rows per page
So in this case ROWS_SCANNED shows 256 because one complete page was scanned.
Modifying the query to slice on two members from ID like so:
SELECT
{[Measures].[My Measure]}
ON 0
FROM
[MyCube]
WHERE([ID].[ID].&[1]:[ID].[ID].&[2])
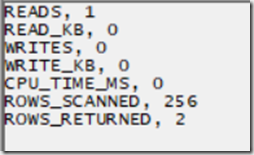
…results in a ROWS_RETURNED of 2 and a ROWS_SCANNED that is still 256, because the two rows must be stored in the same page:
…while asking for 257 members from ID in the WHERE clause like so:
SELECT
{[Measures].[My Measure]}
ON 0
FROM
[MyCube]
WHERE([ID].[ID].&[1]:[ID].[ID].&[257])
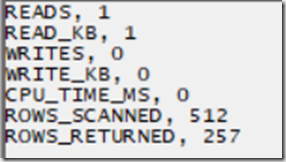
Results in a ROWS_RETURNED of 257 and a ROWS_SCANNED of 257 – obviously 2 pages are now being scanned to get the data needed for the query.
Finally, the query:
SELECT
{[Measures].[My Measure]}
ON 0
FROM
[MyCube]
WHERE([ID].[ID].&[5000])
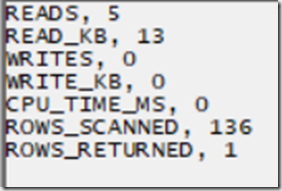
…returns a rows scanned of 136:
This must be because the final page, which doesn’t contain the full 256 rows, is scanned. 5000-136=4864, and 4864/256=19, so there must be 20 pages of data: 19 pages of 256 rows and one final page of 136 rows.
I don’t think it’s worth getting too hung up on the exact values that ROWS_SCANNED and ROWS_RETURNED, especially given that they return totals for all Storage Engine activity for all measure groups for the whole query, but knowing that they tell you roughly how much work is being done my the Storage Engine means that you can use them to watch for warning signs that something isn’t working properly when you’re performance tuning queries. In subsequent parts of this series I’ll show some practical examples of this.
 |
Chris has been working with Microsoft BI tools since he started using beta 3 of OLAP Services back in the late 90s. Since then he has worked with Analysis Services in a number of roles (including three years spent with Microsoft Consulting Services) and he is now an independent consultant specialising in complex MDX, Analysis Services cube design and Analysis Services query performance problems. His company website can be found at http://www.crossjoin.co.uk and his blog can be found at http://cwebbbi.wordpress.com/ . |
Tags: performance


