Storage Engine Caching, Measures and Measure Groups
Reposted from Chris Webb's blog with the author's permission.
I've been doing some performance tuning work on SSAS Multidimensional recently that has forced me to look at some behaviour I've observed several times but never properly understood: what happens with Storage Engine caching when you are querying multiple measures in the same measure group. Here are some of my findings (thanks, as always, to Akshai and Marius for answering my questions on this) although this post only deals with a few basic scenarios.
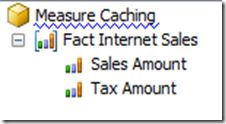
Consider the following, quite basic cube built from Adventure Works. It has one measure group and two measures, Sales Amount and Tax Amount, that both have AggregateFunction Sum:
And a single Date dimension with the following attribute relationships:
If I run a Profiler trace, clear the cache and run the following query twice:
SELECT
{[Measures].[Sales Amount]}
ON 0,
[Date].[Year].[Year].MEMBERS
ON 1
FROM
[Measure Caching]
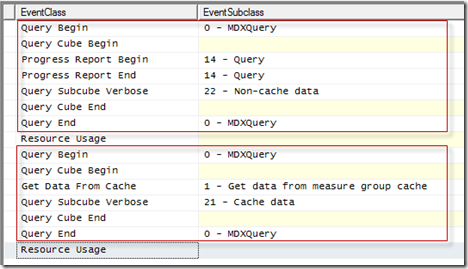
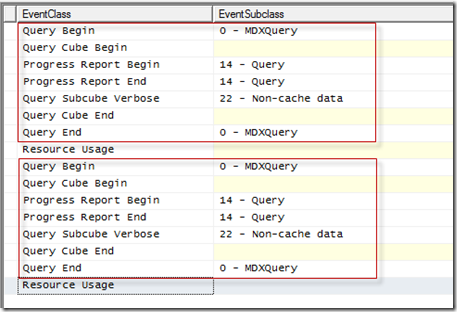
I can see that the first time the query is run it doesn't hit cache, and the second time the query (in the second red box below) is run it does hit the Storage Engine cache:
This is as you'd expect. However, now look what happens when I run a query that returns the Tax Amount measure - which was not in the original query - without clearing the cache:
SELECT
{[Measures].[Tax Amount]}
ON 0,
[Date].[Year].[Year].MEMBERS
ON 1
FROM
[Measure Caching]
Even though this is the first time I've queried for this measure since the cache was cleared, this query still hits the cache. This is because when you query for one measure, the SSAS Storage Engine will retrieve data for all other measures in the same measure group for the granularity of data requested.
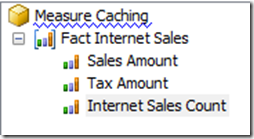
This means that the AggregateFunction property of a measure is significant here. If I add a new measure to the cube with AggregateFunction set to Count instead of Sum:
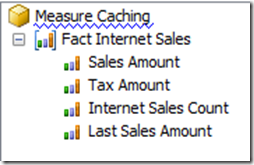
I see the same thing happening, ie queries that request data for Sales Amount or Tax Amount also warm the SE cache with values for Internet Sales Count. This is because a query for Internet Sales Count can be answered with data of the same granularity as a query for Sales Amount. However, if I add a new measure called Last Sales Amount with AggregateFunction Last Non-Empty:
And then clear the cache, and run the two following queries one after the other:
SELECT
{[Measures].[Sales Amount]}
ON 0,
[Date].[Year].[Year].MEMBERS
ON 1
FROM
[Measure Caching]
SELECT
{[Measures].[Last Sales Amount]}
ON 0,
[Date].[Year].[Year].MEMBERS
ON 1
FROM
[Measure Caching]
I can see that the first query does not warm the cache for the second query - both queries go to disk:
Why is this happening? Why isn't the cache being used? A clue lies in the Query Subcube Verbose event for both queries. For the first query, using Sales Amount, the following granularity of data is being requested:
Dimension 0 [Date] (0 0 0 *) [Date]:0 [Month]:0 [Quarter]:0 [Year]:*
Whereas the second query, using Last Sales Amount, requests this granularity:
Dimension 0 [Date] (* 0 0 *) [Date]:* [Month]:0 [Quarter]:0 [Year]:*
Both queries have Years on rows, but because Last Sales Amount is semi-additive the values returned are actually from the Year and Date granularity. So, when the semi-additive measure is requested in the second query the data needed for it is not in the Storage Engine cache: the first query requested data at the Year granularity only.
From what I understand, the logic governing this behaviour is very complex and the exact query plan that gets generated will depend on the overall design of your cube, the AggregateFunction used for the measures in each measure group (measures with measure expressions are going to work in a similar way to semi-additive measures) and the queries you're running. However it is useful to be aware of this kind of behaviour when designing and tuning SSAS cubes. For example, it could be that if you have a large number of measures (tens or even a hundred) in the same measure group it could be worth splitting them out into separate measure groups to improve performance, especially if some measures are never queried together - you would need to test this thoroughly first though. This behaviour would also be relevant in cases where you're designing aggregations manually.
 | Chris has been working with Microsoft BI tools since he started using beta 3 of OLAP Services back in the late 90s. Since then he has worked with Analysis Services in a number of roles (including three years spent with Microsoft Consulting Services) and he is now an independent consultant specialising in complex MDX, Analysis Services cube design and Analysis Services query performance problems. His company website can be found at http://www.crossjoin.co.uk and his blog can be found at http://cwebbbi.wordpress.com/ . |
Tags: design, mdx, management, performance

