Using Scoped Assignments To Show Calendar and Financial Year-To-Date Values In The Same Calculated Measure
Reposted from Chris Webb's blog with the author's permission.
I've had a lot of requests for more MDX content on my blog, so here's something I've been meaning to write up for a long time: a worked example of how to use scoped assignments to implement two different types year-to-date calculation on two different hierarchies in the same dimension. Knowledge of how to use scoped assignments is the sign of a true MDX master (you can watch a video of a session I gave on the basics of scoped assignments at SQLBits here if you're unfamiliar with them) but that's because they can be very difficult to write and there's surprisingly little information out there on the internet about them. They are incredibly powerful, though, and often they provide the most elegant and best-performing way to solve a problem.
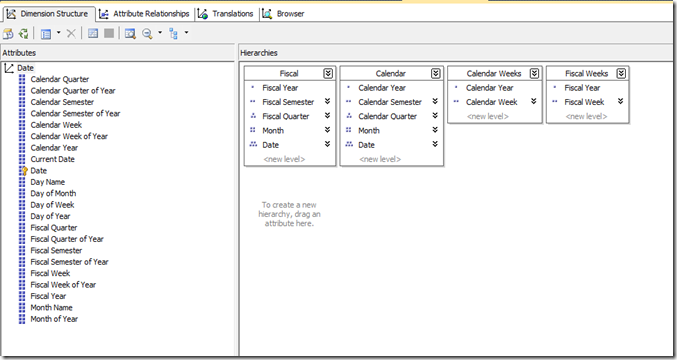
Let's start by looking at the Date dimension in the Adventure Works DW sample database, and more specifically the attributes, user hierarchies and attribute relationships:
Notice how we have two user hierarchies for Calendar Years (which start on January 1st) and Fiscal Years (which start on July 1st), called Calendar and Fiscal. Now, let's say that you have a requirement to to show year-to-date values for a measure for both the Calendar and Fiscal hierarchies. It would be very easy to implement this as two separate calculated measures but what if you needed to show both types of year-to-date in the same calculated measure, showing Fiscal year-to-dates when the Fiscal hierarchy was used in a query and Calendar year-to-dates when the Calendar hierarchy was used in a query?
This is possible using scoped assignments. The first thing to point out, though, is that this is only going to be possible if you change the structure of the dimension. Why? Well, take a look at the Date levels of both hierarchies: they are both built using the Date attribute. If you were running a query with your YTD calculation on columns and only the Date attribute hierarchy on rows, would you expect to see Calendar or Fiscal YTD values? Certainly you couldn't see both in the same cell, and this is the problem: if you expect to see Calendar YTD values at the bottom of your Calendar hierarchy, and Fiscal YTD values at the bottom of your Fiscal hierarchy, you need two separate Date attributes to do this. If you overwrite the values in the same cells twice using a scoped assignment, then you will only see the result of the second assignment.
Therefore, what we need to do is to create two new attributes, Calendar Date and Fiscal Date, to serve as the lowest levels of the Calendar and Fiscal hierarchies instead of the Date attribute. Here's what the new attribute relationships look like:
From the end-user's point of view nothing seems to have changed (these new attributes can have their AttributeHierarchyVisible property set to False) but this now means we have two attributes, two different slices of the cube, whose values we can overwrite separately instead of just one.
Now for the MDX. A good rule to follow when writing scoped assignments is to always use attribute hierarchies and never use user hierarchies; this is because there are rules you have to obey about the shape of the subcube of data you are overwriting with your scoped assignment. When defining a scope using only attribute hierarchies, you can only use the following types of set:
- Every single member on the attribute hierarchy
- Just one member on the attribute hierarchy
- Multiple members on the attribute hierarchy not including the All Member
I wrote up a detailed set of rules for defining scopes in MDX Solutions, if you're interested; if you don't follow these rules you'll get the infamous "An arbitrary shape of the sets is not allowed in the current context" error (I know a joke about that, incidentally).
For this calculation, we need to make two scoped assignments on a single calculated measure called [YTD Sales]: one to show the Fiscal YTD calculation for the Fiscal Date, Fiscal Month Name, Fiscal Quarter, Fiscal Semester and Fiscal Year attributes; and one to show the Calendar YTD calculation for the Calendar Date, Calendar Month Name, Calendar Quarter, Calendar Semester and Calendar Year attributes. When scoping on ranges of attributes like this, there's another easy rule to follow: scope on the set of every member, including the All Member, from the attribute hierarchy at the lowest granularity attribute, and the set of every member, not including the All Member, from the highest granularity attribute. These two sets also need to be in the same, rather than separate, SCOPE statements for reasons I explain here.
This results in the following MDX:
CREATE MEMBER CURRENTCUBE.MEASURES.[YTD Sales] AS NULL;
SCOPE(MEASURES.[YTD Sales]); --Calendar YTD
SCOPE([Date].[Calendar Date].MEMBERS, [Date].[Calendar Year].[Calendar Year].MEMBERS);
THIS = AGGREGATE( PERIODSTODATE([Date].[Calendar].[Calendar Year], [Date].[Calendar].CURRENTMEMBER),
[Measures].[Internet Sales Amount]);
END SCOPE;
--Fiscal YTD
SCOPE([Date].[Fiscal Date].MEMBERS, [Date].[Fiscal Year].[Fiscal Year].MEMBERS);
THIS = AGGREGATE( PERIODSTODATE([Date].[Fiscal].[Fiscal Year], [Date].[Fiscal].CURRENTMEMBER),
[Measures].[Internet Sales Amount]);
END SCOPE;
END SCOPE;
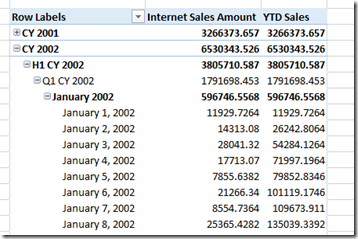
Now you can see the YTD Sales calculated measure returns Calendar YTD values for the Calendar hierarchy:
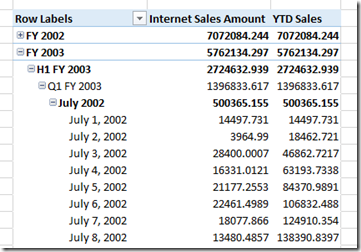
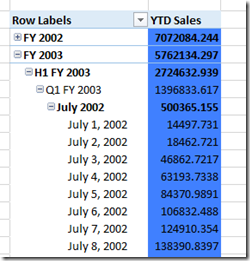
.and it returns Fiscal YTD values for the Fiscal hierarchy:
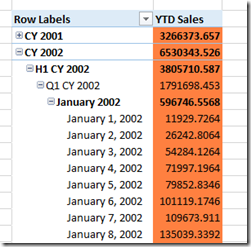
There's one last trick I want to show. It can be very difficult to know that your scoped assignment is covering the subcube you want it to cover, so while debugging scoped assignments I find it helps to assign values to the BACK_COLOR cell property so I can see exactly where I'm scoping. Here's the MDX above with extra assignments to set the cell background colour to orange for the Calendar YTD calculation and blue for the Fiscal YTD calculations:
CREATE MEMBER CURRENTCUBE.MEASURES.[YTD Sales] AS NULL;
SCOPE(MEASURES.[YTD Sales]); --Calendar YTD
SCOPE([Date].[Calendar Date].MEMBERS, [Date].[Calendar Year].[Calendar Year].MEMBERS);
THIS = AGGREGATE( PERIODSTODATE([Date].[Calendar].[Calendar Year], [Date].[Calendar].CURRENTMEMBER),
[Measures].[Internet Sales Amount]);
BACK_COLOR(THIS) = RGB(255,128,64);
END SCOPE;
--Fiscal YTD
SCOPE([Date].[Fiscal Date].MEMBERS, [Date].[Fiscal Year].[Fiscal Year].MEMBERS);
THIS = AGGREGATE( PERIODSTODATE([Date].[Fiscal].[Fiscal Year], [Date].[Fiscal].CURRENTMEMBER),
[Measures].[Internet Sales Amount]);
BACK_COLOR(THIS) = RGB(64,128,255);
END SCOPE;
END SCOPE;
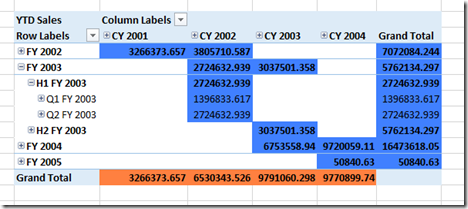
This now shows up in an Excel PivotTable as you can see below:
It can also help you understand what's going on in the scenarios where the scopes overlap, for example if you put the Calendar and Fiscal hierarchies on rows and columns in the same PivotTable: the Fiscal hierarchy takes precedence, because it's defined second.
 | Chris has been working with Microsoft BI tools since he started using beta 3 of OLAP Services back in the late 90s. Since then he has worked with Analysis Services in a number of roles (including three years spent with Microsoft Consulting Services) and he is now an independent consultant specialising in complex MDX, Analysis Services cube design and Analysis Services query performance problems. His company website can be found at http://www.crossjoin.co.uk and his blog can be found at http://cwebbbi.wordpress.com/ . |
Tags: mdx

